
4. June 2021 By Eva-Maria Kynast
UX KPIs and metrics – measuring the key to a satisfied customer
Why should we measure UX?
In general, the interaction between UX KPIs and UX business objectives should ensure that the UX objectives support the overall business objectives. The contribution user experience makes to the success of a company can be made visible and comprehensible using defined UX KPIs. The selection of general business objectives is usually a mixture of economic, marketing and customer-centred goals, and therefore the UX KPIs should also cover all these areas.
There are many reasons for measuring UX KPIs. On the one hand, there is stakeholder management. Arguments based on facts and figures provide a better basis for successful persuasion. Without any metrics, it is impossible to determine at any point in time whether the measures that have been implemented were either effective or efficient. With reliable data, you can argue better and possibly also get more out of the next budget planning for you and your UX team.
Another reason for measuring is UX benchmarking. First of all, you should find out where your company or project actually stands in relation to UX. Then you can also begin to set your sights on your UX goals and approach them step by step. With your UX KPIs, you can check whether you are still on the right track and intervene if necessary. You can also compare your company, project or product with competitors or even internally. If things go well, you will be able to make your successes visible.
UX KPIs also serve as an early warning system that allows you to determine whether you need to intervene in some aspects because something is going wrong. KPIs are not just numbers; the numbers also say something. There are some very high values, which are mostly good values, but there are also low and alarming values and it is best not to ignore these.
What are UX KPIs in general?
First of all, it is important to make clear that there is a difference between UX KPIs and UX metrics. The latter attempt to measure user experience and convert it into numbers. These metrics are often recorded within usability tests and are therefore product-related.
UX KPIs, on the other hand, are key performance indicators that are collected over a specified period of time and then evaluated to measure the success of the UX measures used within a company. They translate the success factors of the company or software into a numerical format and thus reveal successes and failures. They provide information on whether a company is getting closer to its defined UX goals or has even achieved them.
UX KPIs and metrics have the difficult task of translating human behaviour, opinions and perceptions into an interpretable numerical format. Furthermore, they are different for each project and should therefore always be determined individually. Since every company also pursues different UX goals, there are numerous UX KPIs with a wide range of focuses.
What types of UX KPIs and metrics are there?
UX KPIs related to an organisation
Organisational UX KPIs provide information on how advanced companies are in the area of UX.
- UX budget
- This KPI represents the amount of money a company has available for all UX measures.
- Number of UX professionals
- The number of employees in a company who perform a UX role – for example, usability engineer, usability tester or UX designer.
- Number of UX measures
- The number of UX measures refers to the frequency of UX methods used – for example, user research or usability tests.
- UX maturity level
- The UX maturity level of an organisation is obtained by combining the KPIs mentioned above – for example, UX budget, number of UX professionals and number of UX measures. This means that the UX maturity level always increases whenever the UX KPIs are improved.
UX metrics related to a user
User-centred UX metrics often distinguish between behavioural (what they do) and attitude-related (what they say) metrics. Behavioural metrics express what a user effectively does and how they interact with a product. These tend to be the low-cost metrics, as they can be collected without much outside help. For example, no time-consuming interview is necessary; the figures can usually be collected automatically. The attitude-related metrics measure the emotional situation or verbal comments of the users before, during and after they have used a product. These forms of metrics can be measured during usability tests or collected within surveys.
- Behavioural metrics
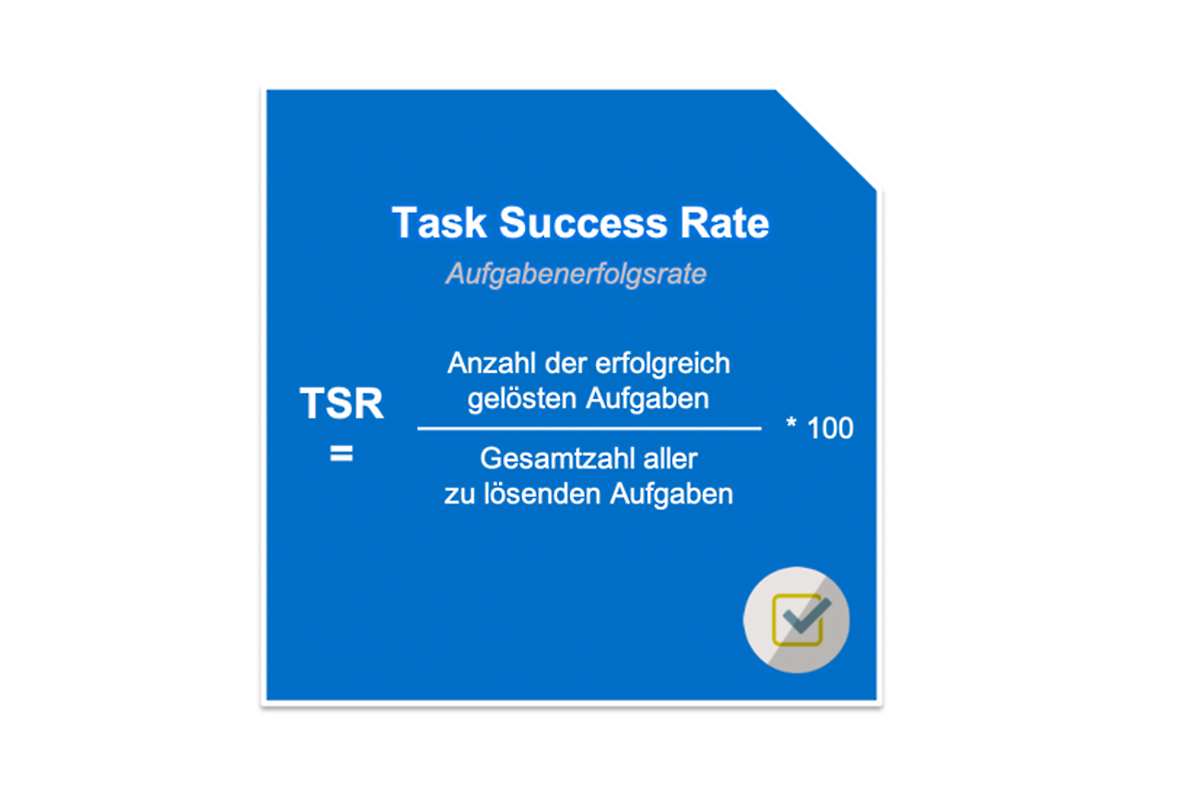
- Task Success Rate - TSR
Proportion of users who successfully complete a task within a usability test. The prerequisite is that the task has a fixed end point.

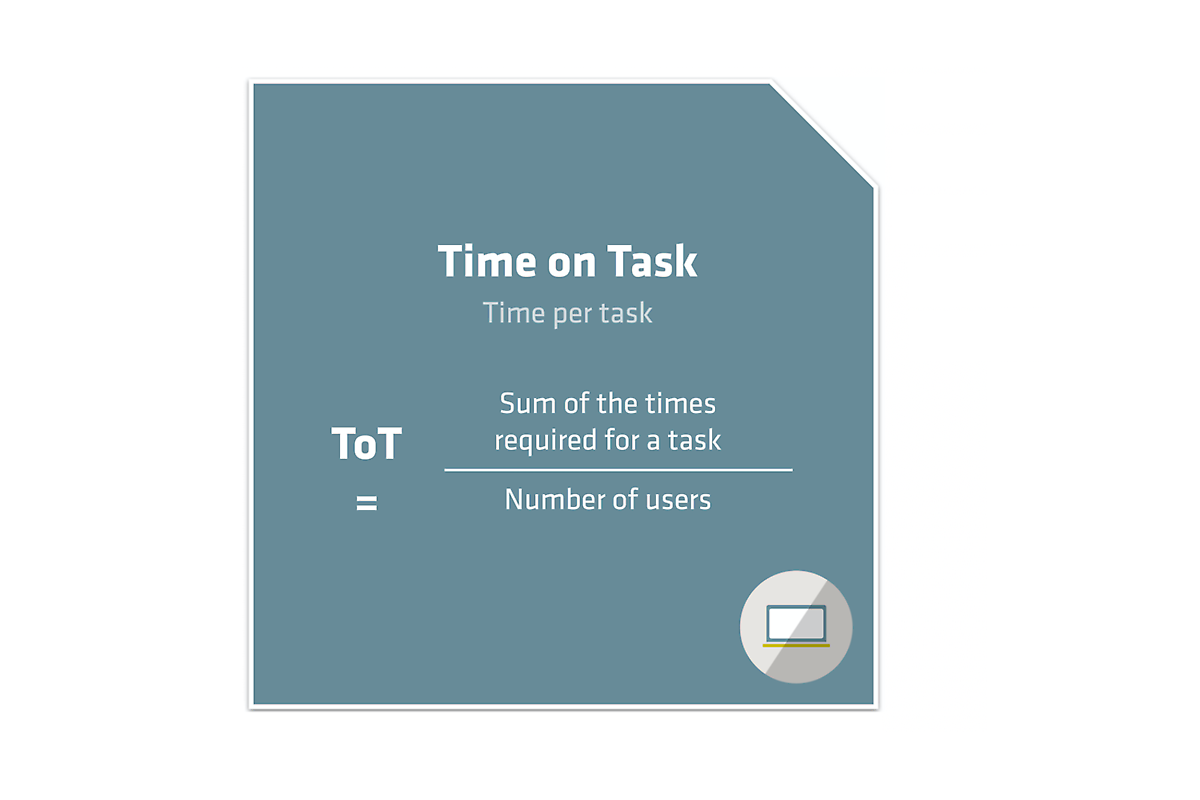
- Time on Task - ToT
Average time required by a user to successfully complete a set task. Here, the average time is often used as the final UX metric. The less time a user takes to complete a task, the better the user experience.

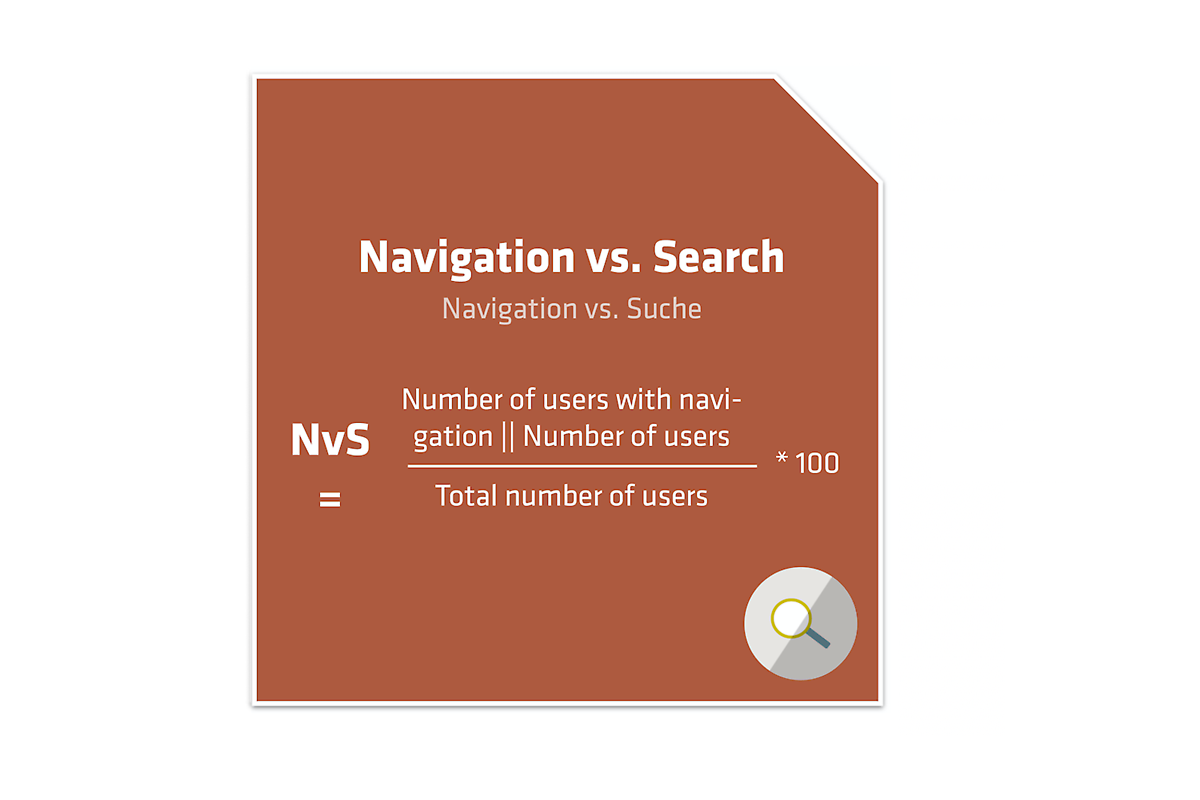
- Navigation vs. Search - NvS
Proportion of users who used website navigation for a specified task compared to the proportion of users who used the search function for the same task. The more users have used the navigation, the better the user experience. It is always better to determine the preferred ratio of these metrics individually.

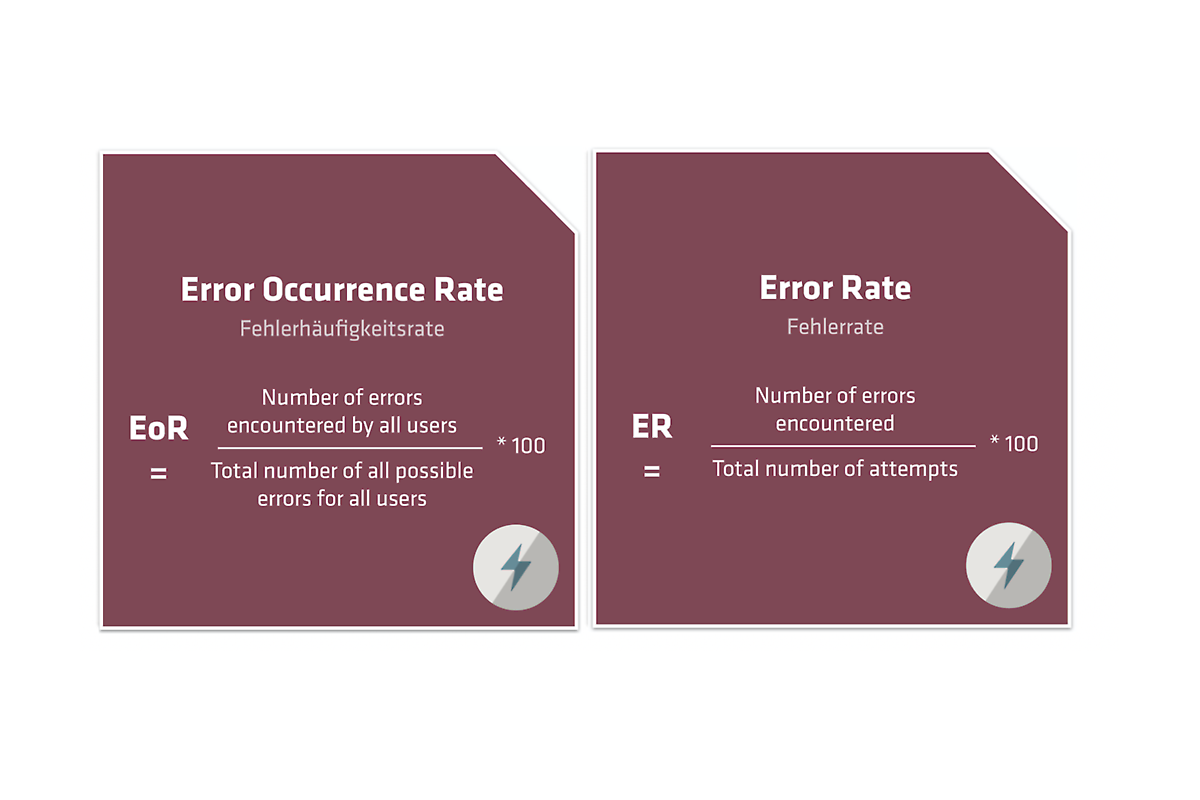
- User Error Rate - EOR or ER
The UER provides information on how often a user carries out an unintended action, makes incorrect entries or even omits important actions. In contrast to the Task Success Rate, a number that is as low as possible is desirable here. However, here too, it is important to individually determine which actions constitute an error. The user error rate is designed to give an impression of how user-friendly the application is or where users have problems understanding it. There are two different calculation options for this metric – Error Occurrence Rate (EOR) and Error Rate (ER):

Attitude-related metrics
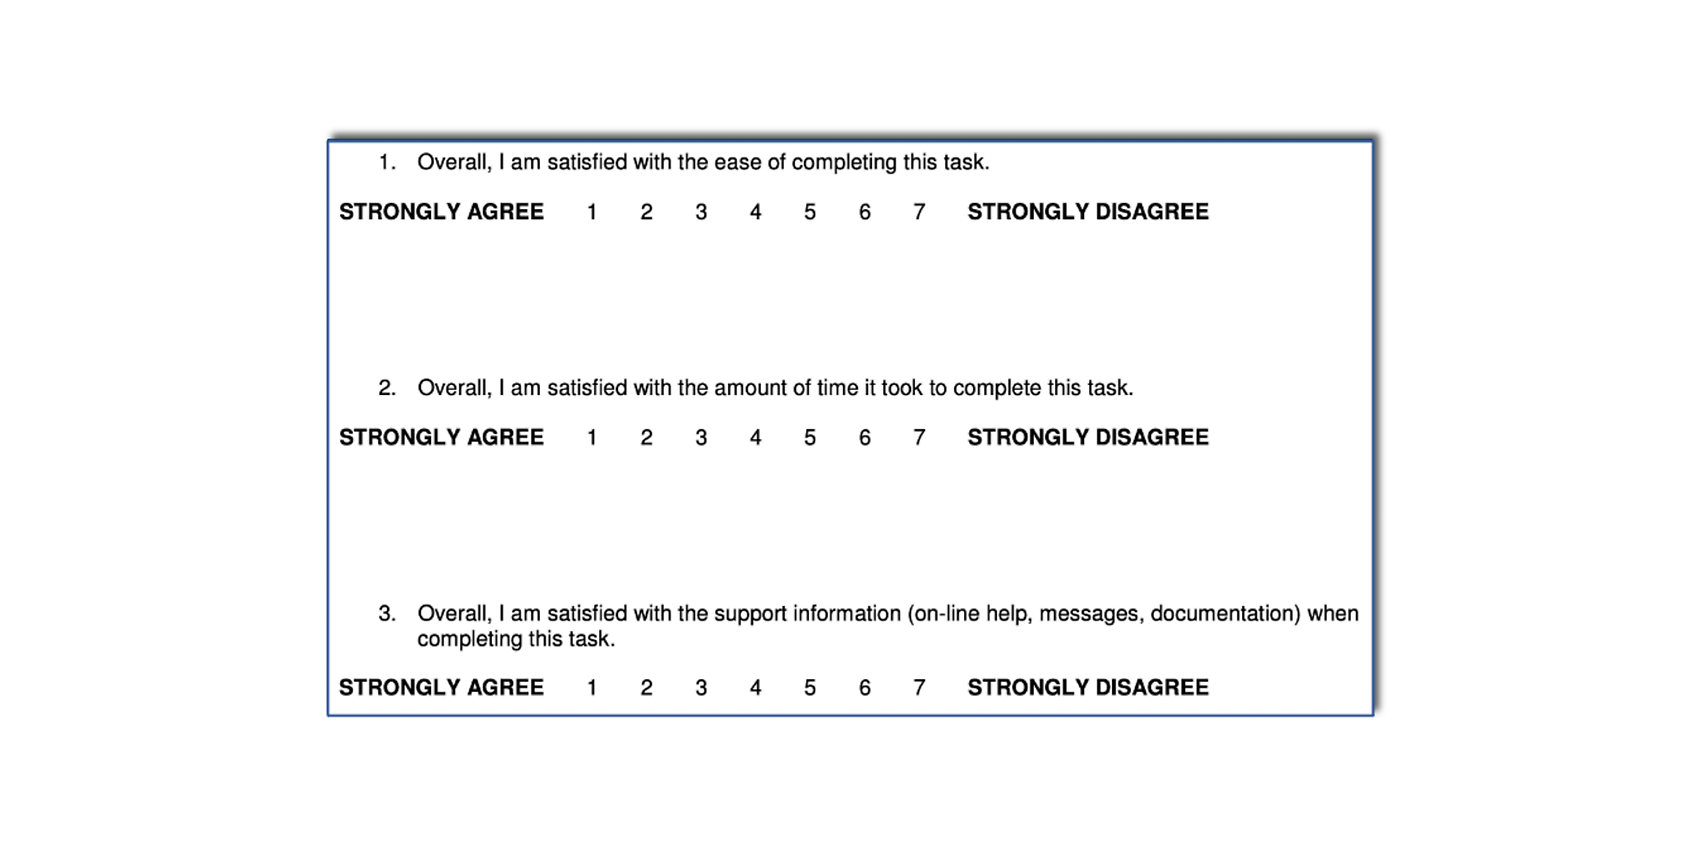
Attitude-related metrics include Post-Test Satisfaction Ratings and Post-Task Satisfaction Ratings. Here, two questionnaires are presented first that relate to the user’s overall impression after a complete test, followed by a questionnaire relating to a recently completed task.
System Usability Scale - SUS
A questionnaire that surveys the perceived user-friendliness by means of ten statements. The user can choose from five ratings for each statement. The result of this questionnaire is the SUS score that is between 0 and 100. It should be 68 on average. Anything above this is considered positive.
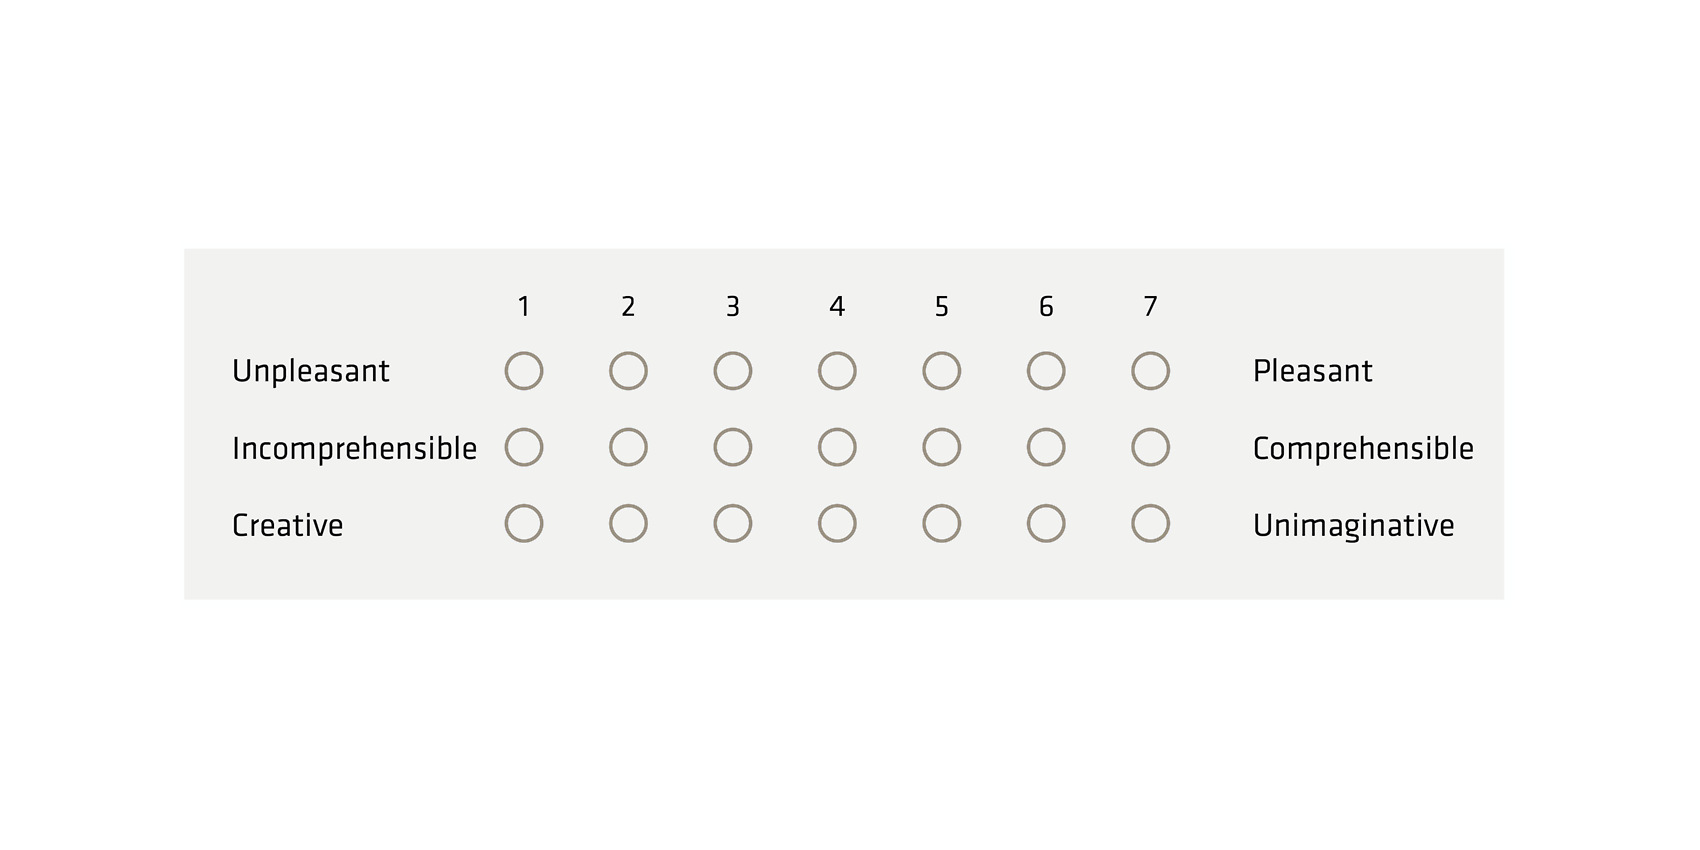
User Experience Questionnaire - UEQ
This questionnaire reflects the subjective user experience by means of 26 opposing pairs of adjectives that are evaluated on a scale of one to seven according to the extent to which they apply. Each rating is assigned a number between -3 and +3. The mean value is taken from the statements and can be evaluated as follows:
< -0.8 = negative;
-0.8 to +0.8 = neutral;
> 0.8 = positive
UX KPIs related to marketing
The marketing-centred metrics are probably the best known ones. They check how successful sales promotion measures are or have been and what the recommendation rate is.
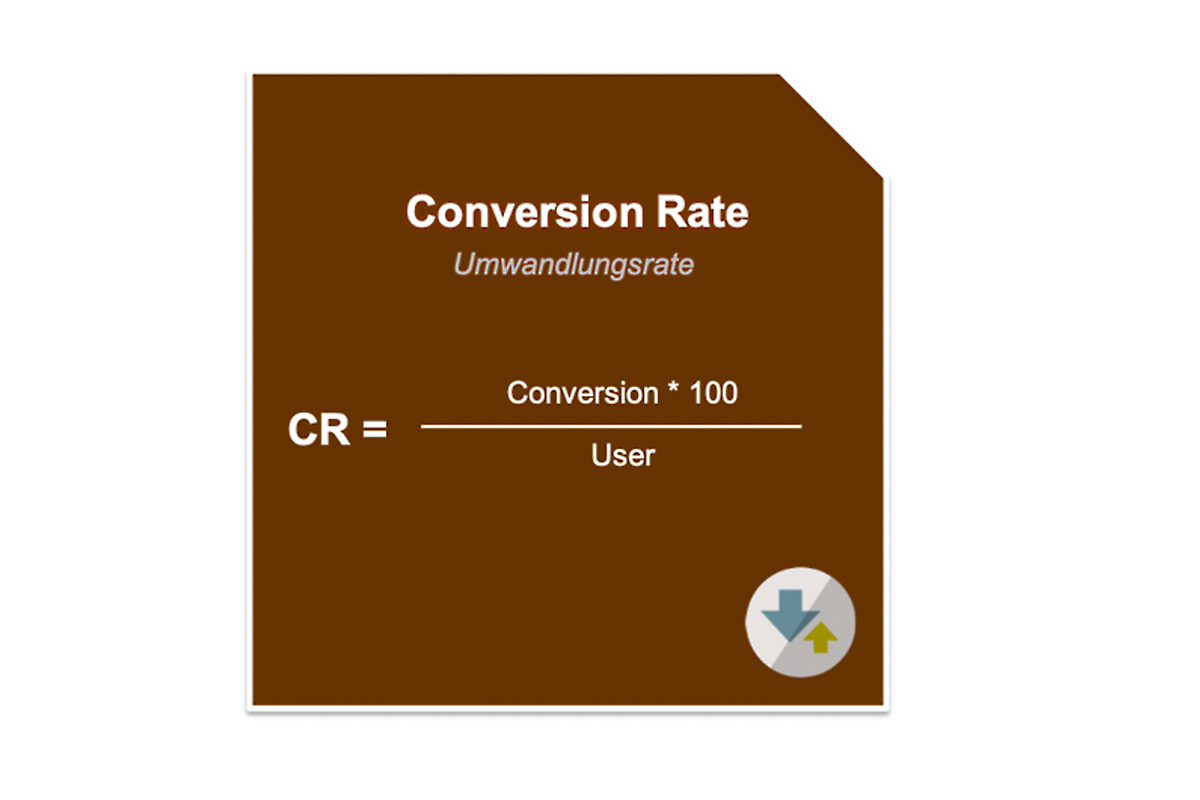
Conversion Rate - CR
The Conversion Rate refers to the percentage of visitors to a website who actually purchase a viewed product. A Conversion Rate that is greater than ten per cent is very good. In online shops, this rate tends to be between three and five per cent. Measures can be taken to optimise conversion, such as improving usability.

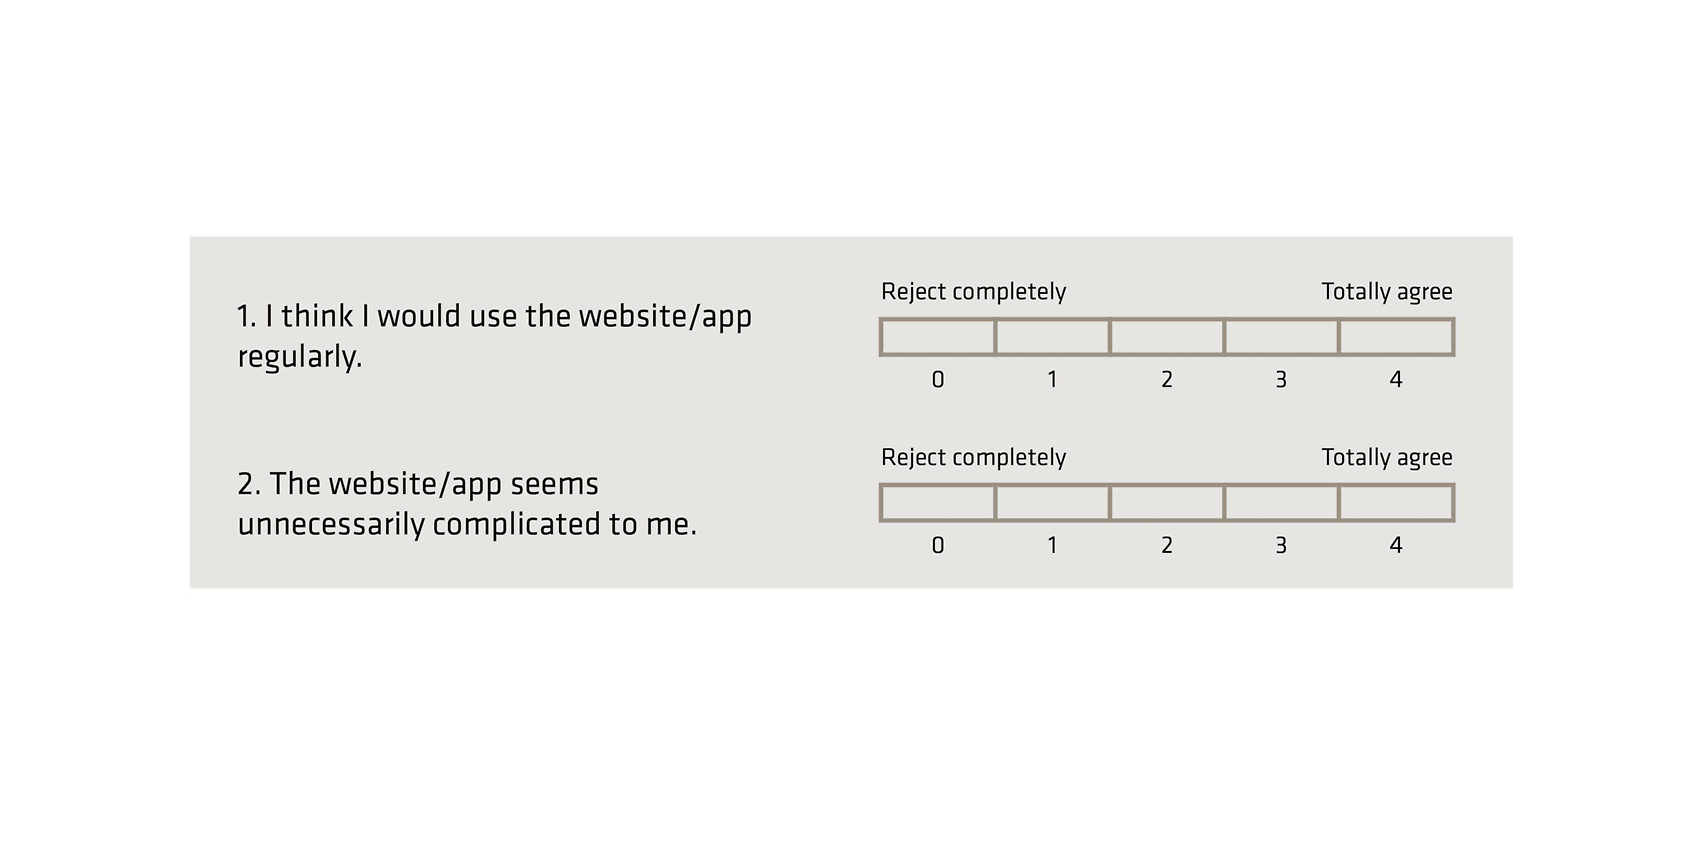
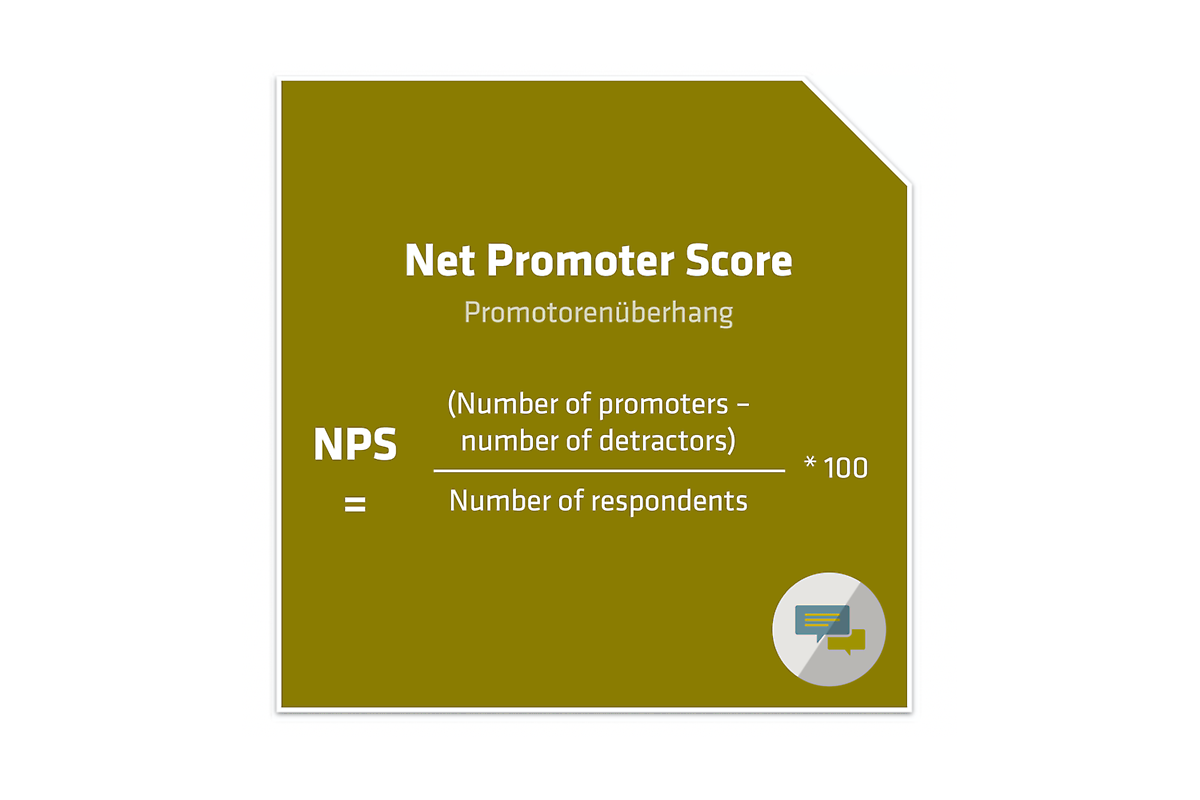
Net Promoter Score - NPS
The Net Promoter Score is also one of the attitude-related metrics and measures, on a scale from 0 to 10, the likelihood that customers would recommend a product and/or service to others. Detractors make up the largest proportion, as their answers range between 0 and 6. Indifferents are people who choose values between 7 and 8. Genuine promoters are therefore only people who select 9 or 10. The NPS ranges between -100 and +100. Generally, it is described as good when it is between 0 and 50, very good when it is between 51 and 75 and exceptional when it above 75. Most companies range between 20 and 40.

UX KPIs related to the economy
We talk about economy-centred UX KPIs when time and money can be saved by carrying out UX optimisations. For example, the Return on Investment (ROI) – as a measure of the cost-benefit ratio – can be attributed to UX measures. If a new function or a new product is introduced, this should result in a noticeable benefit for the end user. The implementation potential and relevance can be determined by measuring customer benefit on the basis of actual market demand. The ‘customer benefitֹ’ indicator can therefore serve as an important decision-making aid for saving costs or setting the correct focus.
Which key figures are the most suitable?
Now that you are familiar with the different UX KPIs and metrics, you should ask yourself which of these key figures are the right ones for your company/project.
You can find this out in three steps.
The easiest way to set the goal is to answer the following question: How should a good user experience improve the life of the user? The description of such a goal could be as follows, for example: Employees of a service provider should be able to record working hours quickly and easily with the help of an application.
The associated indicators for the set goal should indicate how you can get closer to this goal. In the time recording example, a suitable indicator would be the level of satisfaction, for example.
The last and probably most difficult step involves determining the key figures that can be used to measure the achievement of goals. To make our ‘satisfaction’ indicator measurable, we can choose the key figures of the Net Promoter Score (NPS) and User Experience Questionnaire (UEQ).
Conclusion
Measuring, analysing and evaluating UX key figures makes sense at any time. The earlier this is started, the quicker comparative figures can be drawn. The advantage of consistently using UX KPIs and metrics can be seen in the following three points:
- Early detection of weaknesses and problems
- A reliable and argumentative basis for the success of the UX commitment achieved in order to be able to make valid decisions, especially internally, and further advance the topic of UX in general.
- Integration of a complete UX strategy
Would you like to learn more about exciting topics from the world of adesso? Then check out our latest blog posts.

Category: |
|
Tags: |
Customer satisfaction Costumer Experience |